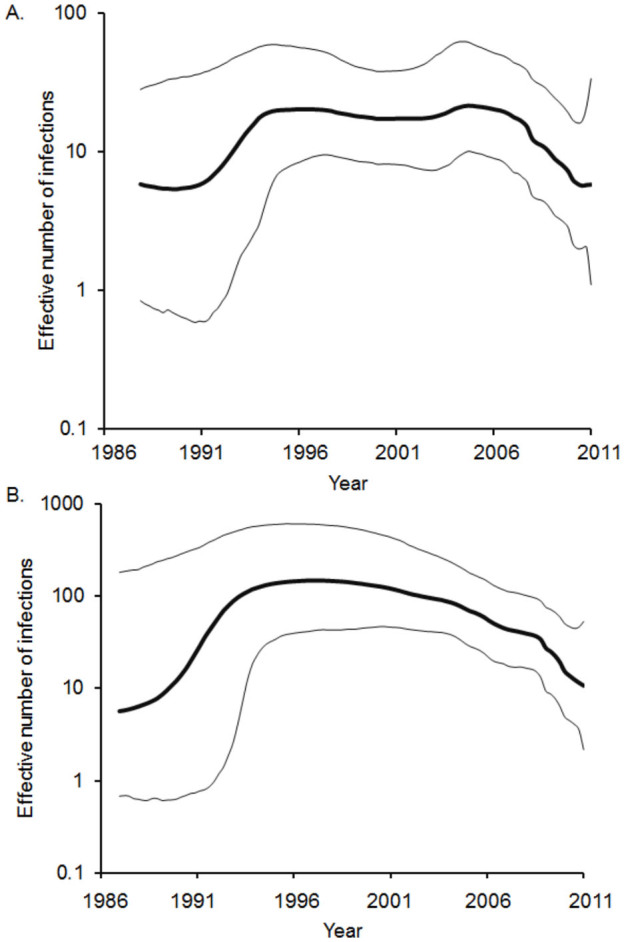
Figure 3. Bayesian skyline plots (BSP) depicting population dynamics of Asian lineage (lineage IV) of PPRV.

BSPs inferred from partial (A) N gene and (B) F gene depicting changing levels of genetic diversity (Neτ) of the PPRV-IV sampled between 1987 and 2011. The bold line represents the median estimate; the thin gray lines give the 95% HPD interval of the estimates.
