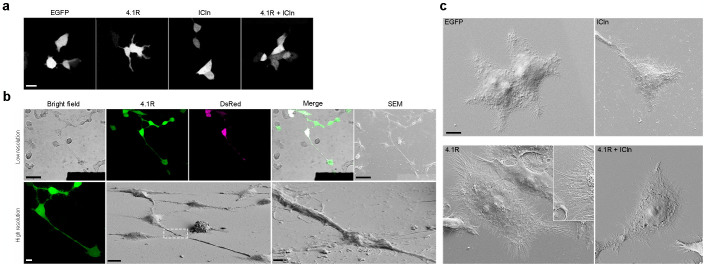
Figure 2. 4.1R expression increases cell area and the number of filopodia protruding from cell edges.
(a) Confocal images showing the morphology of HEK cells overexpressing the indicated proteins (only the EGFP channel is shown). The area of the cells expressing 4.1R alone is larger than that of the cells expressing EGFP or ICln alone, or those expressing both 4.1R and Icln. Scale bar: 20 μm. (b) CLEM was used to characterise the effect of 4.1R overexpression on cell morphology precisely. The HEK cells adhering to the patterned coverslips were transfected with vectors encoding 4.1R-IRES-EGFP (4.1R) and soluble DsRed (DsRed) (see On-line Methods). The cells expressing the protein of interest were identified in low magnification confocal microscopy fields of view in bright field and fluorescence imaging mode (Merge, upper panel: scale bar 50 μm). High-resolution z-stacks of the selected cells were acquired in order to characterise morphology in living cells (maximum projection shown in left lower panel: scale bar 10 μm). The cells were then processed for SEM, the same field of view was rapidly relocated, and the same cells were imaged at low magnification (right upper panel: scale bar 50 μm), and then high-magnification images were acquired in order to characterise the selected cells morphologically at nanometre resolution (lower panel: scale bar 10 μm; inset 1 μm). (c) Representative SEM images of HEK cells expressing the indicated protein. The overexpression of 4.1R alone (but not the co-overexpression of 4.1R and ICln) increased cell area, as well as the number and density of filopodia. Scale bar 10 μm.

