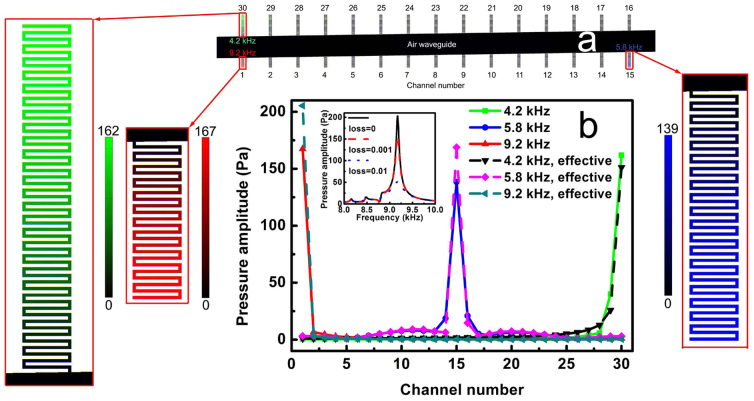
Figure 2.
(a) The pressure amplitude distributions in the air region of the space-coiling structure when the acoustic waves of specific frequencies 4.2 kHz, 5.8 kHz, and 9.2 kHz are incident respectively. Color from green (blue, red) to black indicates pressure amplitude with unit of Pa from maximum value to zero for the frequency of 4.2 kHz (5.8 kHz, 9.2 kHz). Each of the 30 channels is labeled with a channel number. The insets show the zoomed-in field distributions inside the channels. (b) The pressure amplitude distribution at the bottom of each channel for the space-coiling structure and the effective structure (the structure shown in figure 1(c), denoted as “effective”). The inset shows the frequency dependence of the pressure amplitude at the bottom of channel 1 with different loss for sound propagation in air. The incident pressure amplitude is 1 Pa.

