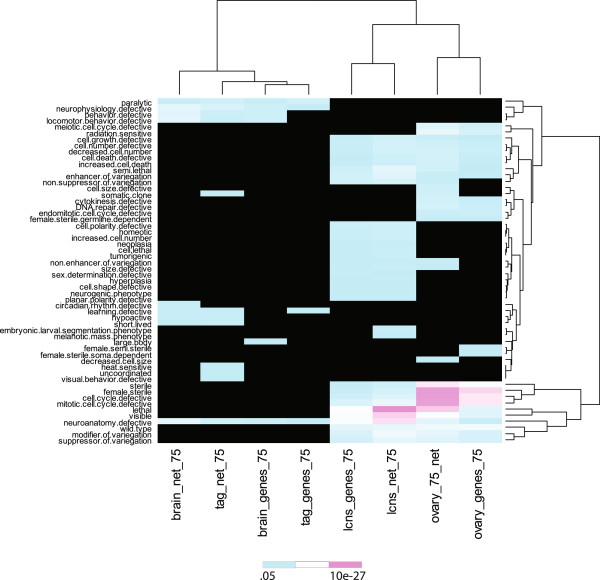
Figure 4.

Heat map of enriched phenotypes in 75 pmax filtered networks compared to 75 pmax filtered gene lists. Heat map of enriched phenotypes obtained when genes expressed at 75 pmax or networks of genes expressed at 75 pmax in 4 different tissues were used as query genes and compared to random gene lists or networks. The p-values were log transformed, scaled and plotted.
