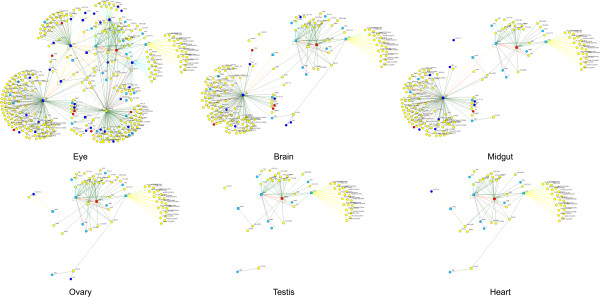
Figure 6.

Applying gene expression filters for different tissues disrupts the eye network. The eye-relevant network (upper left) from Figure 5 was filtered to remove genes that are expressed below 45% pmax in the indicated tissues. The network filtered for brain expression is most similar to the original eye network, yet contains only about half of the proteins and interactions, only 7 of the 15 phototransduction proteins (squares), and less than half of the proteins encoded by genes with eye-related phenotypes. Many of the genes remaining in the filtered networks have no tissue expression data and thus could not have been removed by the expression filter. Colors are as in Figure 5.
