
Figure 7.
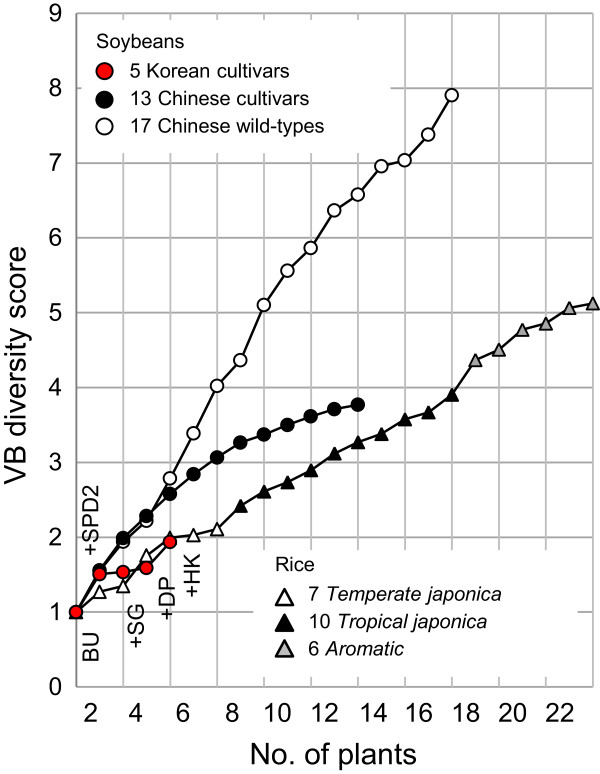
VB diversity scores of soybean and rice genomes. Plot of VB diversity scores with respect to the numbers of successively added soybean and rice genomes. BU, Baekun; SPD2, Sinpaldal2; DP, Daepoong; SG, Shingi; HK, Hwangkeum.
Official websites use .gov
A
.gov website belongs to an official
government organization in the United States.
Secure .gov websites use HTTPS
A lock (
) or https:// means you've safely
connected to the .gov website. Share sensitive
information only on official, secure websites.
VB diversity scores of soybean and rice genomes. Plot of VB diversity scores with respect to the numbers of successively added soybean and rice genomes. BU, Baekun; SPD2, Sinpaldal2; DP, Daepoong; SG, Shingi; HK, Hwangkeum.