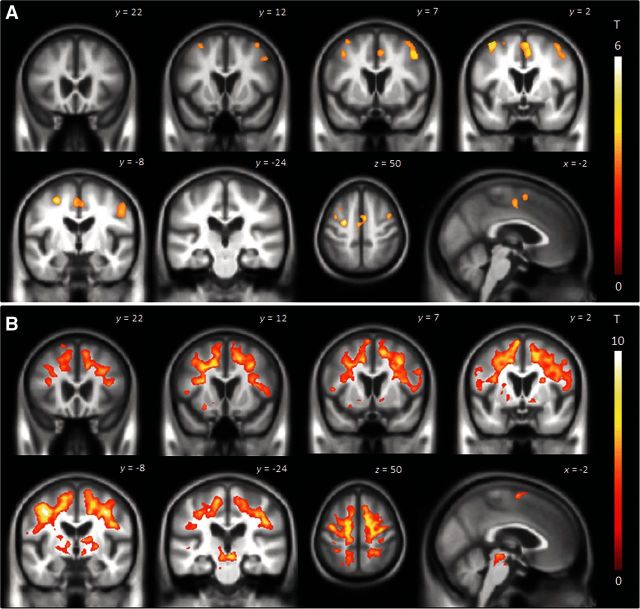
Figure 2.
Patterns of grey matter loss in PPAOS compared to controls at baseline (A) and regions of brain tissue loss over time on tensor-based morphometry in PPAOS subjects compared to controls (B). Results are shown on coronal, axial and sagittal slices of the brain corrected for multiple comparisons at the cluster level using P < 0.05.

