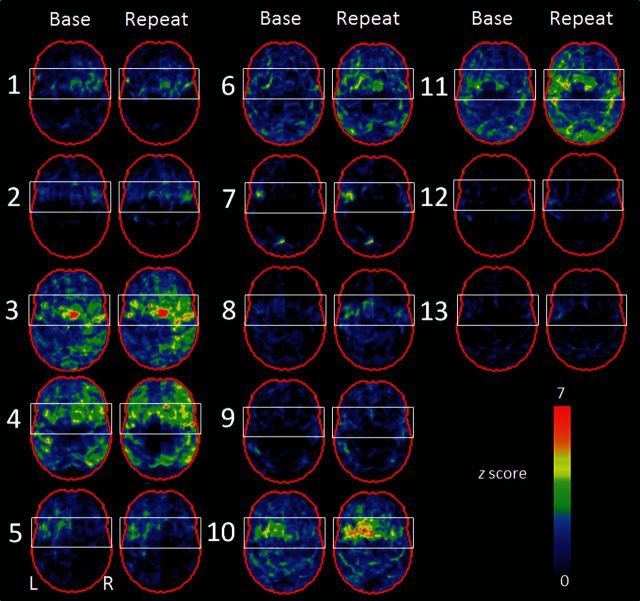
Figure 4.
Statistical stereotactic surface projection maps showing patterns of FDG-PET hypometabolism at baseline and repeat time-points in each of the 13 PPAOS subjects. Subject numbers are shown to the left of each set of images. Z-score values are colour coded as indicated in the colour scale (0 = normal; 7 = most abnormal).

