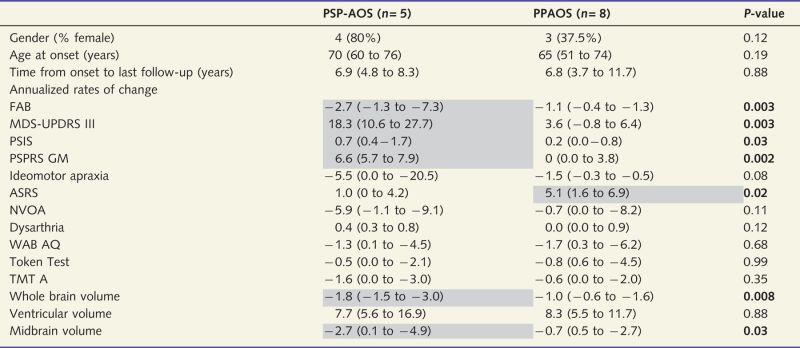
Table 4.
A comparison of the annualized rates of clinical and imaging change over time between subjects that evolved into PSP-AOS and those that remained PPAOS
 |
Data shown as median (range); ASRS = Apraxia of Speech Rating Scale; NVOA = non-verbal oral apraxia; TME = Trail Making Test.
Shaded areas represent more severe change over time.
