
Figure 2.
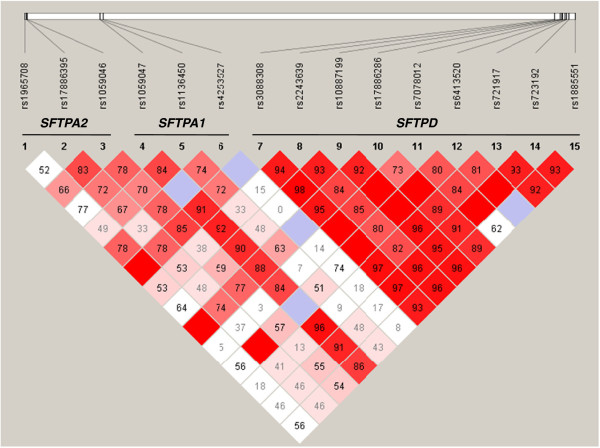
Linkage disequilibrium (D’) among genetic polymorphisms of surfactant proteins in general Spanish population (N = 687). LD plots for pair wise Dʹ between markers and Dʹ values are indicated in percentages within squares in the LD plot. Strong LD is indicated by dark gray/red, whereas light gray/pink and white indicate uninformative and low confidence values, respectively.