
Figure 3.
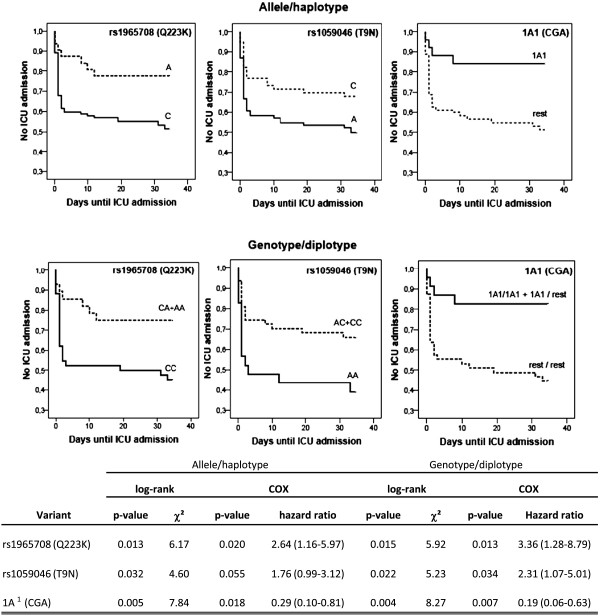
Kaplan-Meier estimation of days until ICU admission in hospitalized H1N1pdm-infected patients according toSFTPA2variants. Only those comparisons with P < 0.05 were included. Solid curves represent the most frequent variant under study, and the dotted curves, the rest of variants. Significance levels calculated by means of log-rank test and Cox regression stratified by hospital of origin and adjusted for the variables age, gender, risk factors, secondary bacterial pneumonia and bacteremia are shown at the bottom of the figure. HR (95% CI), hazard ratio (95% confidence interval).