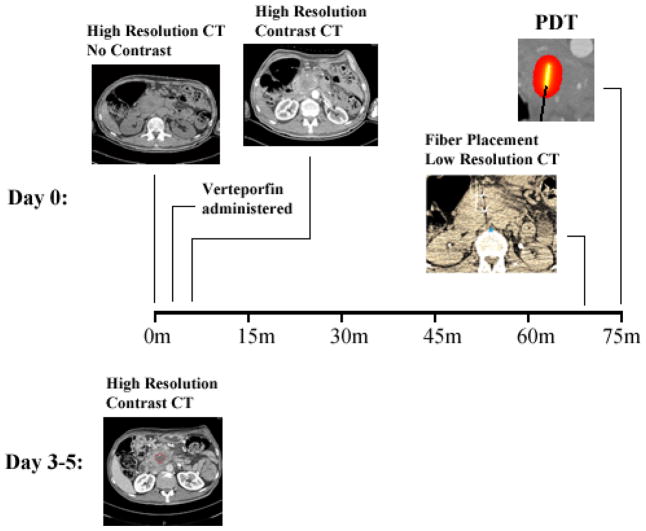
Figure 1.
Patient imaging and treatment workflow. The initial two scans are high resolution, pre- and post-contrast. The lower resolution scan shows the fiducial markers on the fiber, evident in the CT scan as two bright spots with star artifacts from x-ray beam hardening. The post-treatment contrast CT scan shows necrotic tissue as a dark area, circled in red on the scan. The scans are all of axial orientation.

