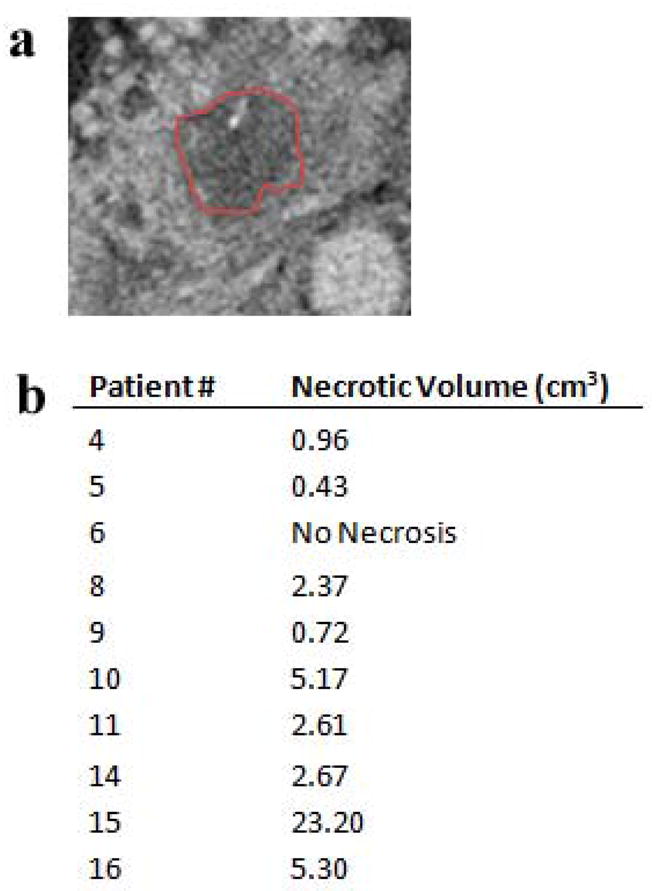
Figure 3.

(a) An axial slice of the pancreas from post-treatment CT scans, with the indicated area in the center as necrotic tissue. (b) The volume of the necrotic tissue region is shown for each patient in the study, determined from the segmentations of the post-treatment CT scans.
