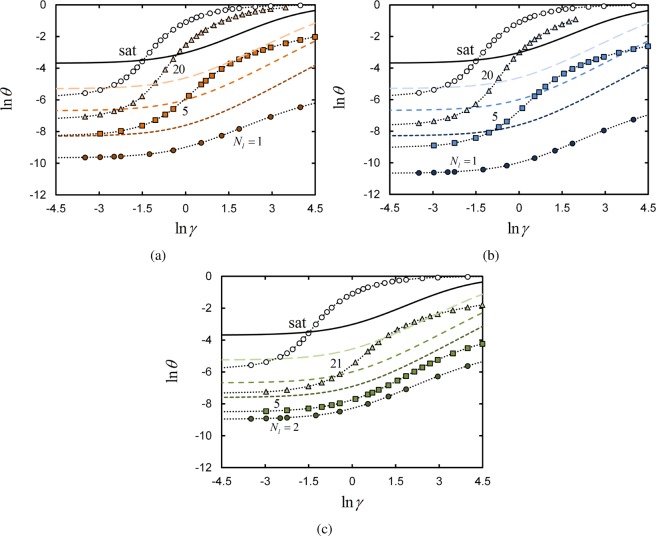
Figure 2.
Log–log plot of the average fraction θ of occupied surface lattice sites, as a function of surface binding parameter γ for systems with ϕpol° = 0.025. Numerical SCFT results (shaded points connected by dotted fit lines) are shown for the terminal linker (a), central linker (b), and uniform linker (c) architectures. In parts a and b, Nl = 1 (circles), 5 (squares), 20 (triangles), and 100 (open circles); in part c, Nl = 2 (circles), 5 (squares), 21 (triangles), and 100 (open circles). Profiles of monomeric linkers, with reservoir concentrations of Nlϕpol/Nt, are computed analytically via the mathematical result from Appendix B. In order of ascending Nl in each image, monomer profiles are plotted as short-dashed, medium-dashed, long-dashed, and solid lines.

