
Figure 1.
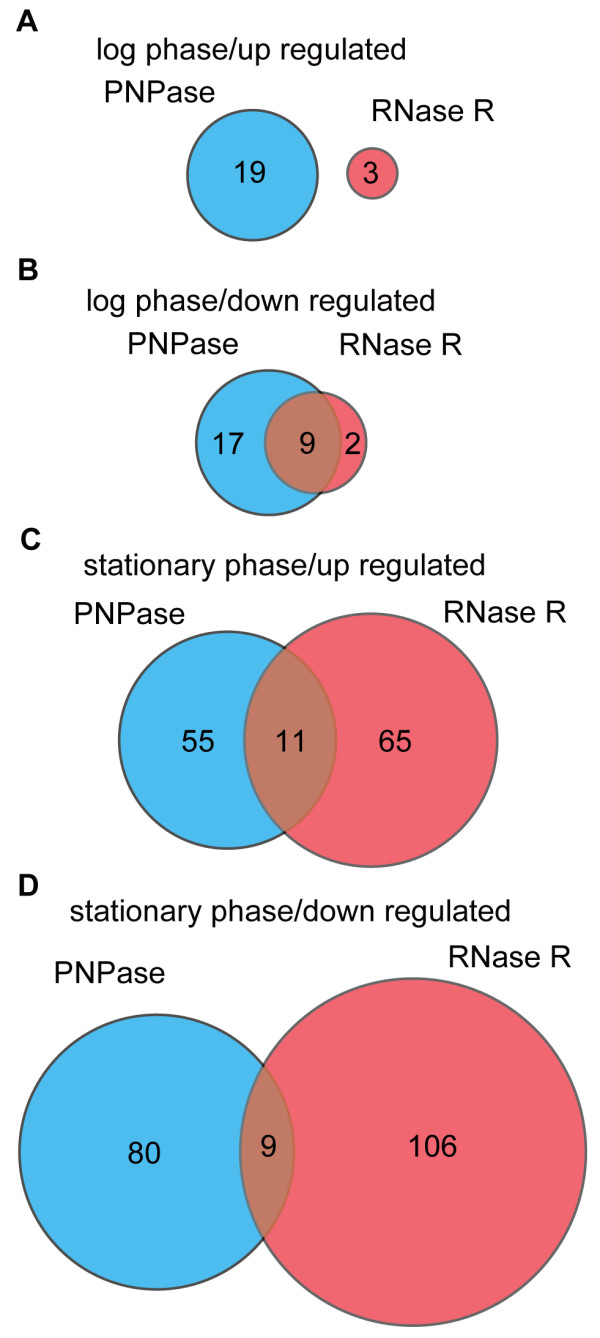
Venn diagram showing mRNA abundance changes after disruption of the PNPase and RNase R genes. The cyan and red circles indicate genes affected by PNPase and RNase R disruption, respectively. The numbers in the circles are the numbers of affected genes in the respective areas. (A) Genes up-regulated during the log phase. (B) Genes down-regulated during the log phase. (C) Genes up-regulated during the stationary phase. (D) Genes down-regulated during the stationary phase.