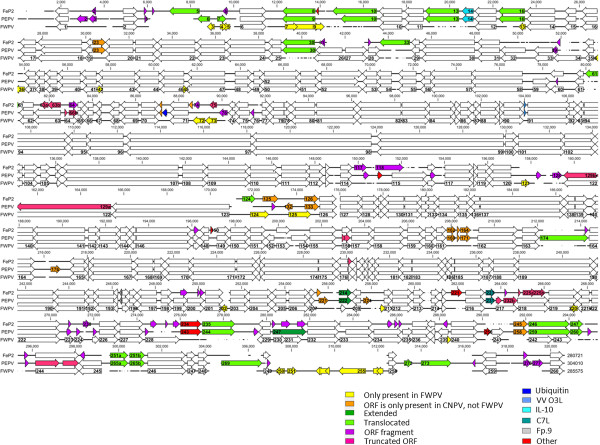
Figure 4.

A multiple sequence alignment (MUSCLE) and comparative ORF map of FeP2, PEPV and FPVUS genomes. Blocks represent ORFs, with arrows depicting the direction of transcription. White blocks depict ORF homologues present in all three genomes at the same/similar location and differences between genomes are labelled and shown as coloured blocks in FeP2 and PEPV relative to FPVUS.
