
Fig. 2.
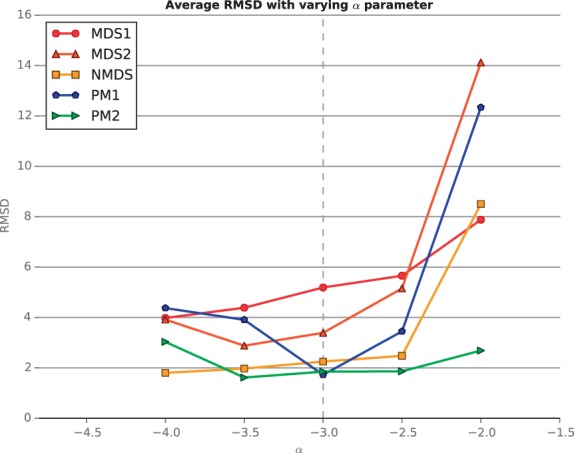
Performance evaluation for simulated data, varying the parameter α. The figure plots the average RMSD of the inferred structures for a range of α values. As α increases, the SNR of the dataset also increases
Official websites use .gov
A
.gov website belongs to an official
government organization in the United States.
Secure .gov websites use HTTPS
A lock (
) or https:// means you've safely
connected to the .gov website. Share sensitive
information only on official, secure websites.
Performance evaluation for simulated data, varying the parameter α. The figure plots the average RMSD of the inferred structures for a range of α values. As α increases, the SNR of the dataset also increases