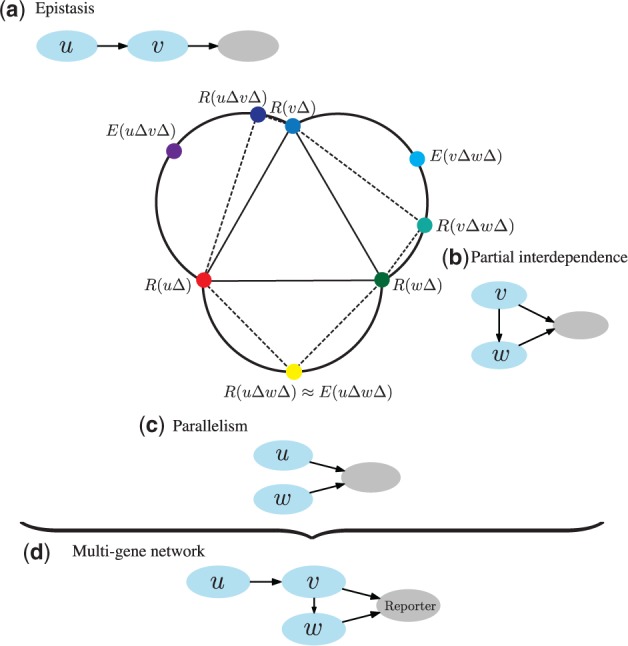
Fig. 1.

A hypothetical example of epistasis analysis with three genes, u, v and w. Nodes in the central graph represent mutant phenotypes. The phenotypic difference between a double knockout [e.g. ] and a single knockout mutant [e.g. ] is represented with the length of the corresponding dotted edge. Expected double mutant phenotypes, which assume no interaction between genes (see also Section 2.1), are denoted with E [e.g. ]. A double mutant (a) has a phenotype similar to that of a single mutant , which indicates that v is epistatic to u. From the activity of genes v and w (b) we conjecture that gene v partially depends on gene w, i.e. v also acts through a separate pathway because their double mutant has a phenotype that is equally similar to the single knockout and the expected phenotype . The phenotype of double knockout (c) is close to the expected phenotype of which may be explained by u and w acting independently in parallel pathways. Gene ordering from these three relations is preserved in the joint network (d), which is a candidate pathway of genes u, v and w
