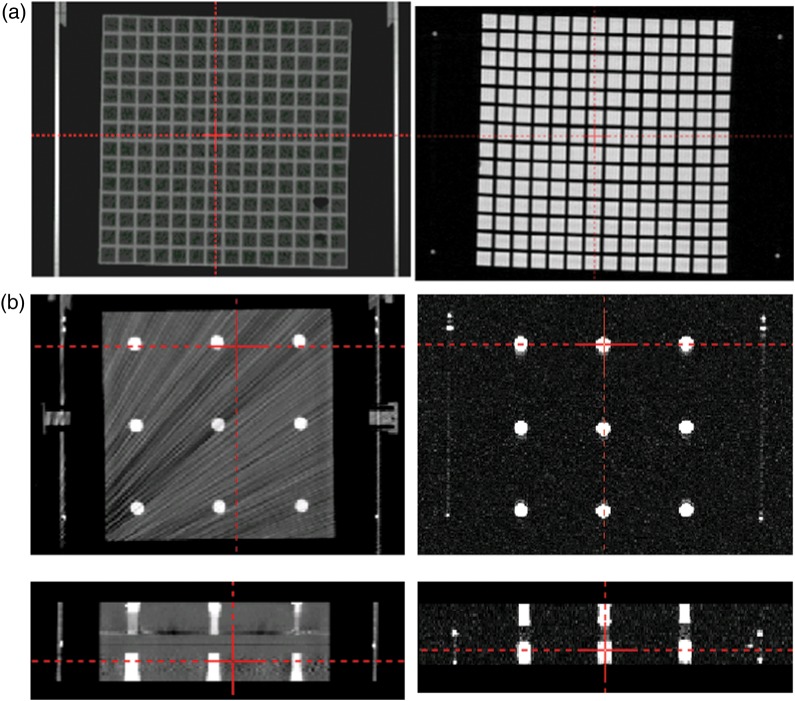
Fig. 2.
Axial images of Phantom A including matrix structure on CT (left) and MR imaging (right). The difference in coordinates for the same gridpoint between CT and MR images is measured by using the crossing point tool in a planning system (a). Axial images (upper) and coronal images (lower) of Phantom B with nine baths on CT (left) and MR imaging (right) (b).

