Figure 2.

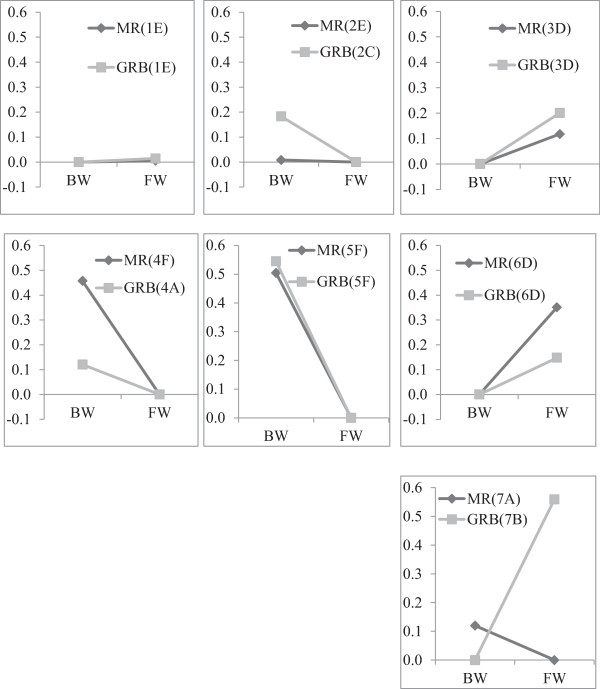
Clusters genomic reaction norm, where MR and GRB absolute fold changes are illustrated on the same standardised scale. K-mean categories defined in Figure 1 are given for each cluster.

Clusters genomic reaction norm, where MR and GRB absolute fold changes are illustrated on the same standardised scale. K-mean categories defined in Figure 1 are given for each cluster.