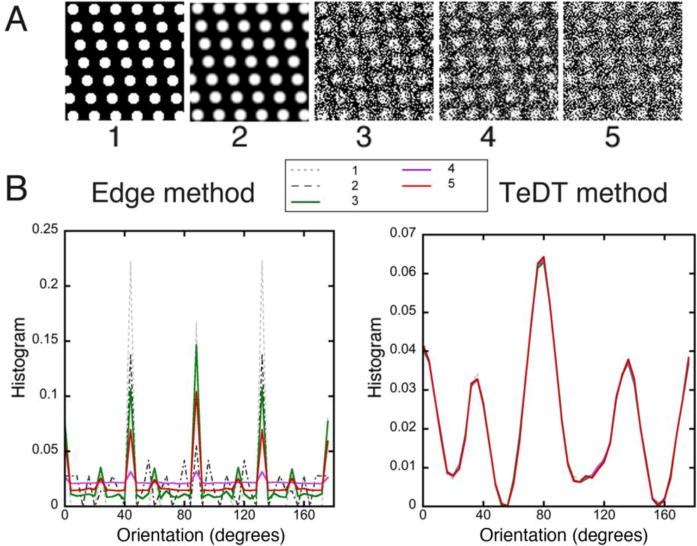
Fig. 3. Image processing procedures do not impact TeDT results.

The original dot image and several variants obtained by image processing (A) were analyzed; 1: original image; 2: image processed by a smoothing filter; 3: image 2 with addition of salt-and-pepper noise; 4: image 2 with addition of Gaussian noise; 5: sharpening filter applied to 4. Treatments 2 and 5 were done in ImageJ; 3 and 4 were done in MATLAB with imnoise commands (noise level: 50%). As shown in the histogram plots (B), TeDT results are practically unchanged while Edge method plots show changes in both relative and absolute values of the peaks.
