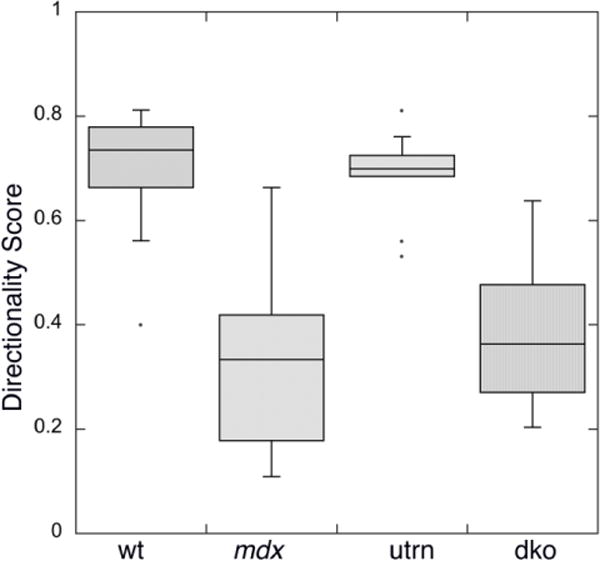
Fig. 5. TeDT analysis confirms and quantitates visual analysis of directionality for fast-twitch muscle microtubules.

Muscle microtubule images were analyzed for each group examined in Fig. 4. The directionality scores D (see methods) were plotted in KaleidaGraph with probability box representation. The scores for wt (0.70 ± 0.12) and utrn (0.69 ± 0.09) are significantly higher than the scores for mdx (0.33 ± 0.17) and dko (0.40 ± 0.16) with p<0.001. No significant difference was detected between wt and utrn (p>0.50), and between mdx and dko (p>0.25).
