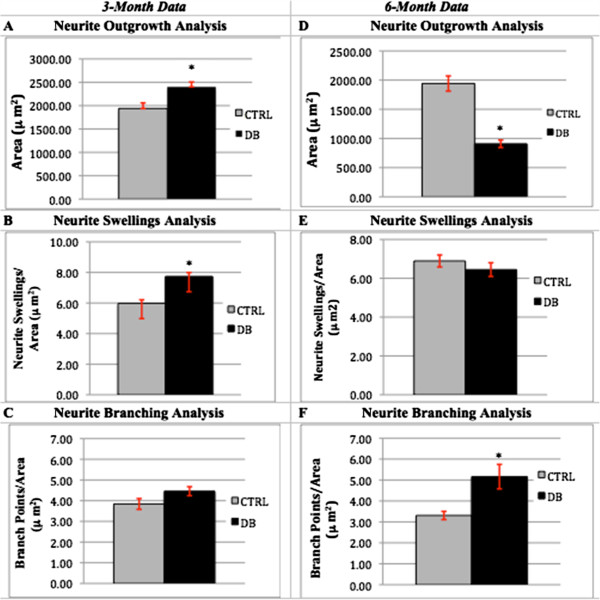
Figure 4.

Neurite outgrowth, neurite swellings and neurite branching as measures of dystrophy. Panels A, B, and C represent the data collected from 3-month control (n = 101) and diabetic (n = 128) rat neuronal cultures. An asterisk (*) indicates statistically significant data. Error bars indicate the mean ± the S.E.M. At 3 months, area (neuronal outgrowth) and the number of neurite swellings were both found to be significantly increased in diabetic neurons, at, respectively, 1.2X (p = 0.0042) and 1.3X (p = 0.01) that of control neurons. Branching was higher in diabetic neurons, although not significantly, at 1.16X the control, p = 0.0688. Panels D, E, and F represent the data collected from 6-month control (n = 129) and diabetic (n = 108) rat neuronal cultures. At 6 months, area was found to be significantly lower in the diabetic neurons, as compared to the control neurons, at 0.48X (p = <0.001). While there was no significant difference between diabetic or control neurons in the amount of neurite swellings (p = 0.3438), the diabetic neurons were seen to have a significantly higher amount of neurite branching, at 1.56X (p = 0.0015) that of the control neurons.
