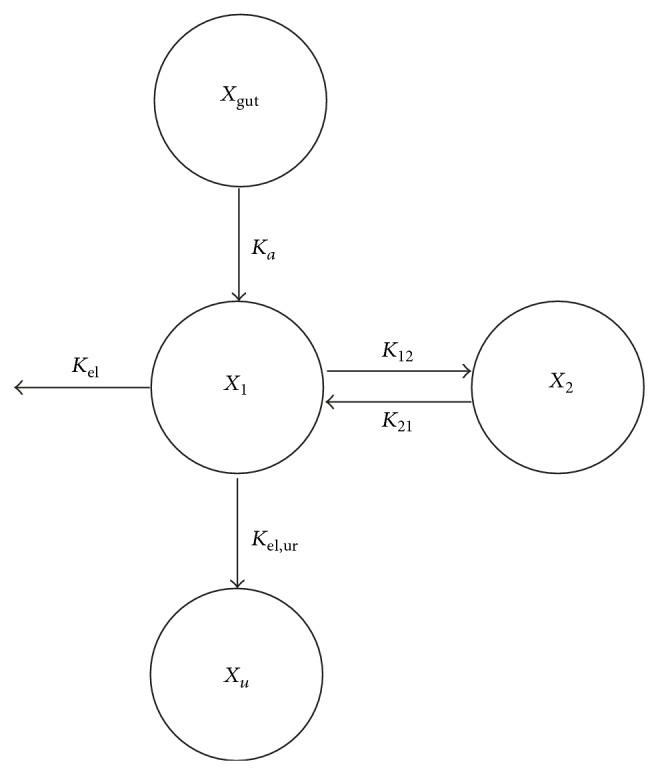
Figure 3.

Schematic diagram of the pharmacokinetic model for baclofen. The model consisted of two compartments and first-order absorption of baclofen. X gut, X 1, X 2, and X urine = amount of drug in the gut, central, peripheral, and urine compartments, respectively; K a = first-order absorption rate constant; K 12 and K 21 = intercompartmental rate constants between the central (X 1) and peripheral (X 2) compartments for baclofen; K el,ur and K el = drug elimination rates into the urine and other processes, respectively.
