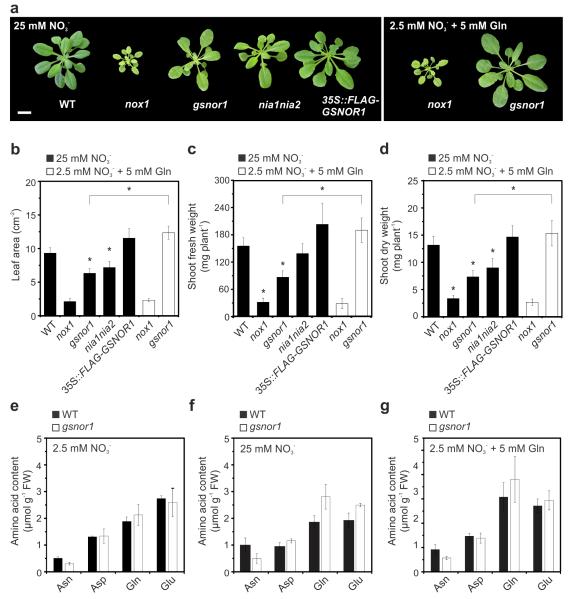
Figure 2. Growth vigour and amino acid content of genotypes with impaired and enhanced (S)NO signalling.
(a) Phenotype, (b) leaf area, (c) shoot fresh weight and (d) shoot dry weight of four-week-old plants grown on perlite:vermiculite (1:1) under 12h/12h light/dark and irrigated three times a week with a MS nutrient solution containing 25 mM nitrate (half KNO3 and half NH4NO3) (black bars) or with 2.5 mM nitrate and 5 mM glutamine. Scale bar, 1 cm. Data points represent means ± SD (n = 15 plants). (e-g) Contents of primary transported amino acids in WT and gsnor1 leaves. Asn, asparagine; Asp, aspartate; Gln, glutamine; Glu, glutamate. Data represent means ± SD of three independent analyses. Asterisks indicate statistically significant difference from WT (P < 0.05, Student’s t test).

