
Figure 1. CT images of study subjects.
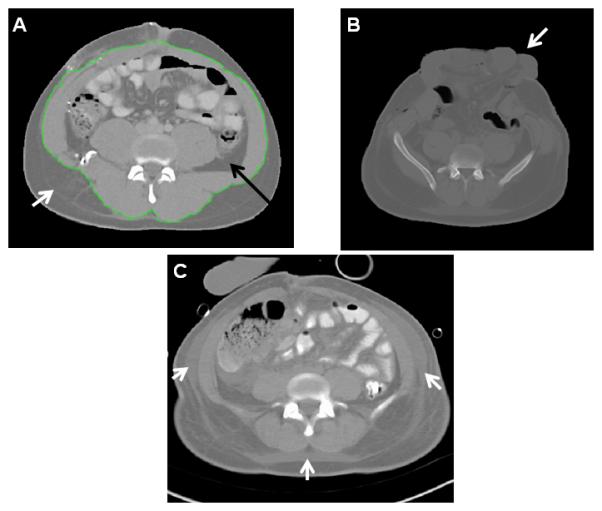
Axial images at the L4-L5 level from abdominal computed tomographic (CT) scans of three study subjects. (A) Delineation of VAT (black arrow) and SAT (white arrow) compartments with tracing (green line) around abdominal wall musculature. (B) CT with open laparotomy incision and protruding viscera (white arrow). (C) CT with extensive edema (white arrows) in subcutaneous adipose tissue. Subjects with CT scans similar to those seen in images B or C were excluded from the primary analysis due to potential inaccuracies in adipose quantitation.