
Figure 2.
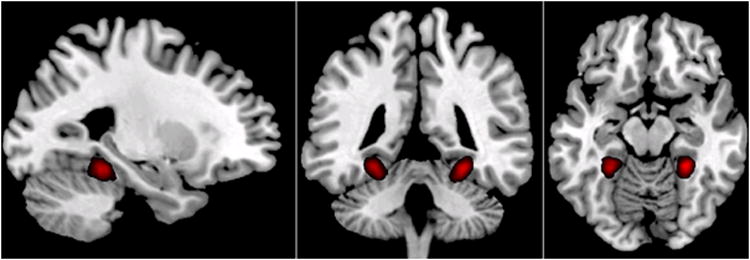
Group average of PPA ROIs used for defining brain states in Experiment 2. All individual PPA masks were spatially normalized, and averaged to create a probabilistic map of PPA ROIs. Here, p > 0.2 was used as a threshold to depict group average of PPA ROIs.