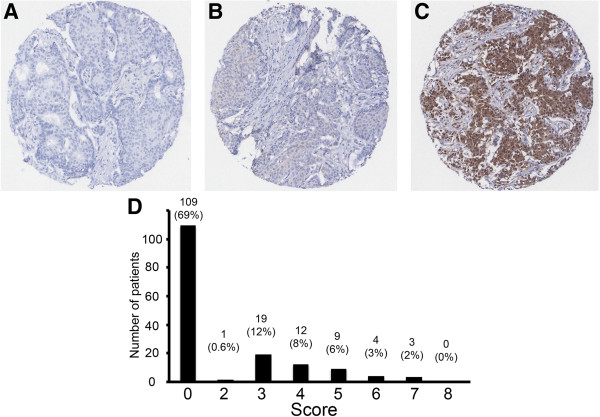
Figure 2.

PSMD9 is variably expressed in breast cancers. A-C Representative staining patterns in individual tissue microarray cores. Cores showing negative staining (A), and staining scored 3 (B) or 7 (C) are shown. D A histogram showing the distribution of immunohistochemistry scores. Scores (x-axis) and numbers of cases assigned to each score (y-axis) are shown. Numbers and percentages of the cohort are given above each bar.
