
Figure 2.
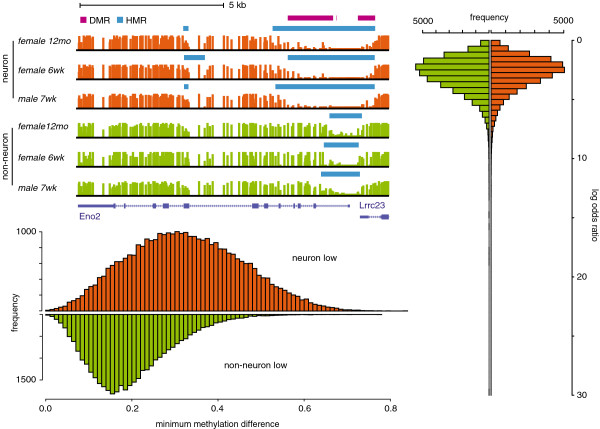
DM regions between neuron and non-neuron samples. (Top left) Methylation profile of the neuron specific enolase (Eno2) – a marker of neuron cells – across frontal cortex samples. (Right) Histogram of log-odds-ratios of DM regions containing at least 10 CpGs. (Bottom left) Histogram of minimum methylation differences of DM regions containing at least 10 CpGs.