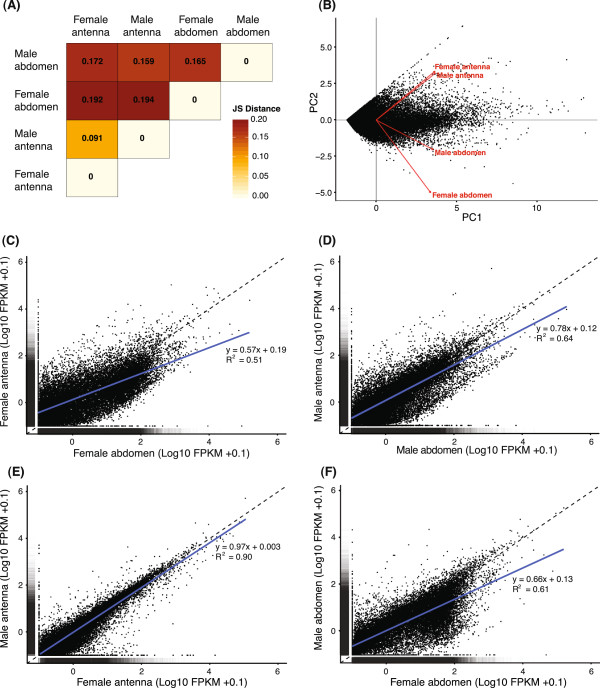
Figure 1.

Comparison of global transcriptome expression profiles. The overall expression levels of the 27 029 genes predicted from the four transcriptomes were compared using Jensen-Shannon (JS) distance (A) and principle component analysis (B), both indicating the high similarity between the male and female antennal transcriptomes. In (B), PC 1 and PC 2 explained 55.8% and 32.2% respectively of the overall gene expression level variation in the four transcriptomes (black dots represent the predicted genes). Both the direction and length (length = within-transcriptome variation) of the eigenvectors (red arrows) show that the male and female antennal transcriptomes had highly similar variation in expression levels, both in relation to PC 1 and PC 2. In contrast, the variation in expression levels differed between the two terminal abdominal transcriptomes, which were also different from the two antennal transcriptomes (as indicated by the different lengths and directions of the eigenvectors). The difference between transcriptomes was explained (mainly) by the expression variation encompassed by PC 2 (i.e. as shown by the position of the four arrow heads). In addition, 1:1 plots (dashed line = 1:1 relationship) in combination with linear regression analyses (blue solid lines) were used to compare transcriptomes pair-wise. The female and male terminal abdomen both had an overall higher expression of the predicted genes compared to the antennae of females (C) and males (D), respectively. As indicated by the slope coefficients and relatively low R2 values, the expression did not follow a 1:1 relationship in these comparisons. In contrast, expression in the male antennae was similar to that in the female antennae, following a close to 1:1 relationship (E). Finally, the female terminal abdomen had an overall higher expression than the male terminal abdomen, i.e. the relationship between the two transcriptomes was relatively far from 1:1 (F).
