
Figure 5.
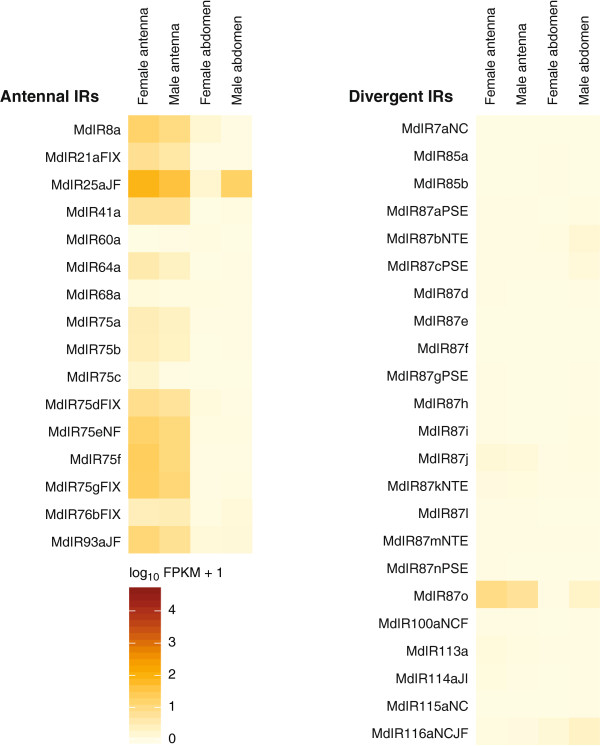
Expression profiles of the genes coding for ionotropic receptors (IR) in M. destructor. Expression levels of the Ir genes in the four transcriptomes represented as heat plots based on log-transformed FPKM values. Zero expression is represented by the lightest yellow color. Suffixes to gene names are explained in the Methods section.