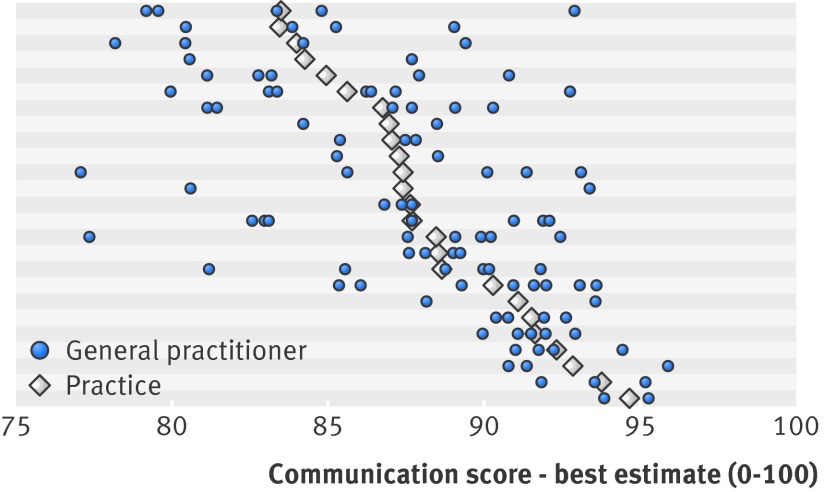
Fig 1 Mean communication score (best estimate) by practice and doctor. Practices (n=25) are sorted by their mean communication score. Horizontal shading serves only as visual separation of results for different practices. Reliability calculations using variance components showed that achieving acceptable reliability (>0.7) for general practitioners’ adjusted mean communication scores with 27 patients’ scores and good reliability (>0.8) with 46 patients’ scores per doctor is feasible (see appendix). All but 10 of the 105 participating doctors had more than 46 scores; two received less than 27 scores (mean 71 scores per doctor). Data for these doctors was retained in the subsequent modelling, as use of best linear unbiased predictors to estimate doctors’ mean scores has a “conservative” effect. Where sample sizes are smaller, estimated mean scores are drawn closer to practice mean

An official website of the United States government
Here's how you know
Official websites use .gov
A
.gov website belongs to an official
government organization in the United States.
Secure .gov websites use HTTPS
A lock (
) or https:// means you've safely
connected to the .gov website. Share sensitive
information only on official, secure websites.
