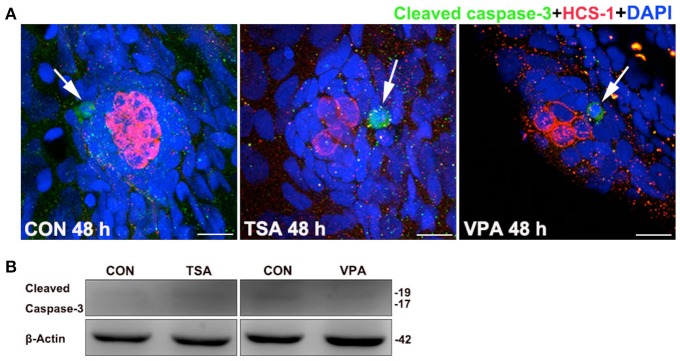
Figure 7.

Effects of HDAC inhibitors on apoptosis. (A) Cleaved caspase-3 staining in the neuromast from a control and TSA- or VPA-treated larva. White arrows indicate cells with cleaved caspase-3. Scale bar = 10 μm. (B) After treatment of larvae with 0.1 μM TSA or 100 μM VPA for 48 h, protein extracts were prepared and subjected to western blot assay using an antibody against cleaved caspase-3. β-Actin was included as the control.
