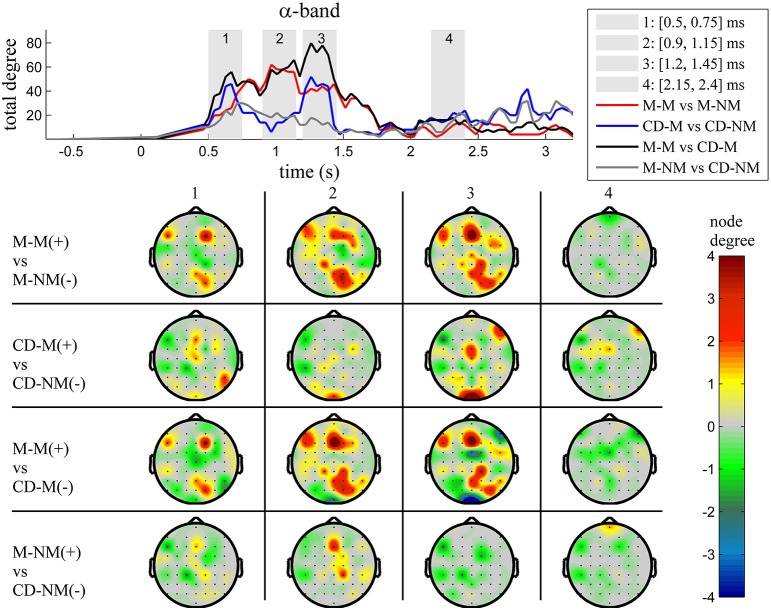
Figure 5.
α band (8–12 Hz). Top: Temporal evolution of the total degree of the networks whose connections represent statistically significant differences in the GC distributions for each pair of electrodes, across four planned comparisons, namely, M-M vs. M-NM, CD-M vs. CD-NM, M-M vs. CD-M and M-NM vs. CD-NM trial types. Four characteristic time intervals are marked with gray bars (1: [0.5, 0.75] s, 2: [0.9, 1.15] s, 3: [1.25, 1.5] s, 4: [2, 2.25] s). Bottom: Topographic maps of node degrees of the statistically different networks resulted from the four planned comparisons, within each one of the characteristic time intervals.

