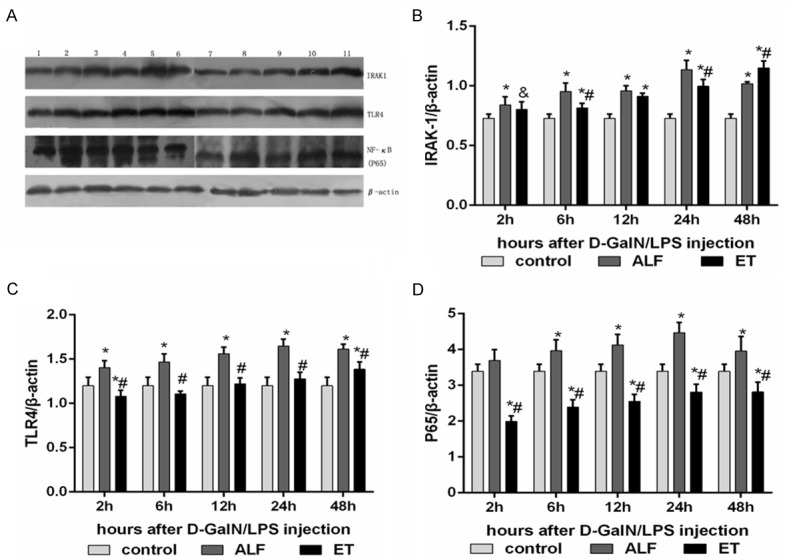
Figure 4.

Inhibitory effects of LPS pretreatment on protein abundance NF-κB pathway in the liver of acute liver failure. A displays typical pictures of mRNA abundance in the liver. (B-D) shows the quantitative levels of IRAK-1, TLR4 and P65 protein measured by Western blot respectively. Label M = mark; Lane 1 as control rat; Lane 2-6 represent rat liver of ET+ALF group at 2h, 6h, 12h, 24h, 48h after injection of D-GalN/LPS; Lane 7-11 represent rat liver of ALF group at 2h, 6h, 12h, 24h, 48h after injection of D-GalN/LPS. Levels of IRAK-1 (B), TLR4 (C) and P65 (D) were standardized to β-actin content. All data were expressed as mean ± SD of six rats at every point of time. *Represents P < 0.05 versus control group; ∆indicates P < 0.05 versus ALF group, #indicates P < 0.01 versus ALF group.
