Figure 1.

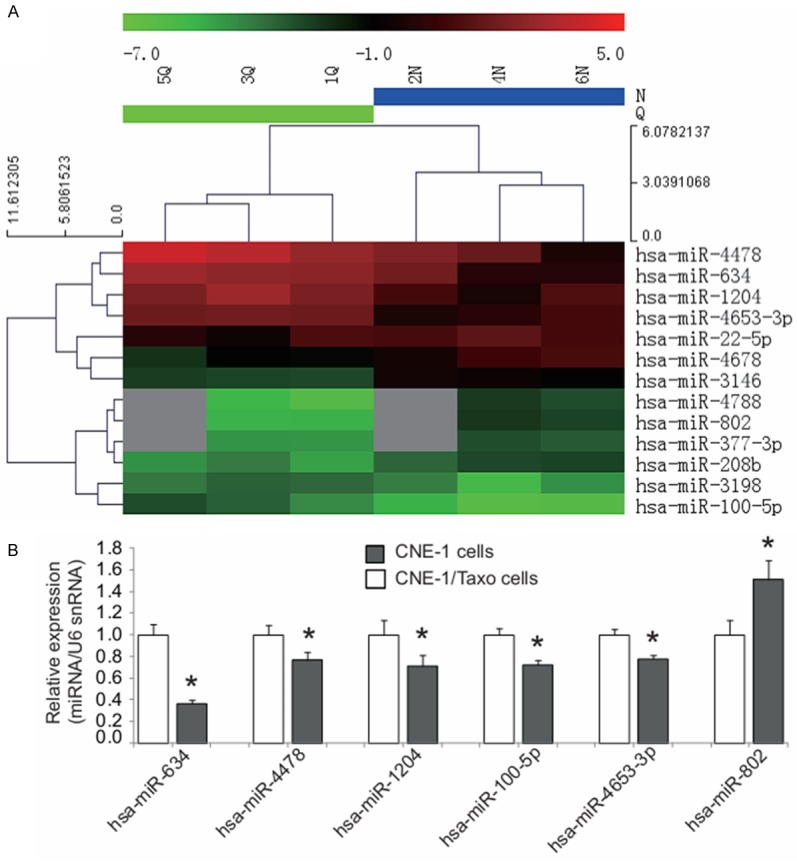
Screening and validation of miRNAs associated with paclitaxel resistance in CNE-1 cells. A. Hierarchical clustering analysis of 13 differentially expressed miRNAs detected by the miRNA microarray analysis in the paclitaxol-resistant CNE-1/Taxol cell sublines (n = 3, N2, N4, N6) compared to the parental CNE-1 cells (n = 3, Q1, Q3, Q5). The heat map diagram shows the results of the two-way hierarchical clustering analysis of miRNA expression levels and the cell lines. Each row represents a miRNA and each column represents a cell line. The miRNA-clustering tree is shown on the left and the cell line-clustering tree is at the top. The color scale shown at the top illustrates the relative expression level of a miRNA in a certain slide. A red color represents a high relative expression level and a green color represents a low relative expression level. B. Six differentially expressed miRNAs were validated by qRT-PCR in the paclitaxol-resistant CNE-1/Taxol cell sublines. There were five significantly downregulated (miR-634, miR-4478, miR-3198, miR-100 and miR-4653) and one significantly upregulated (miR-802) miRNAs consistent with the microarray results.
