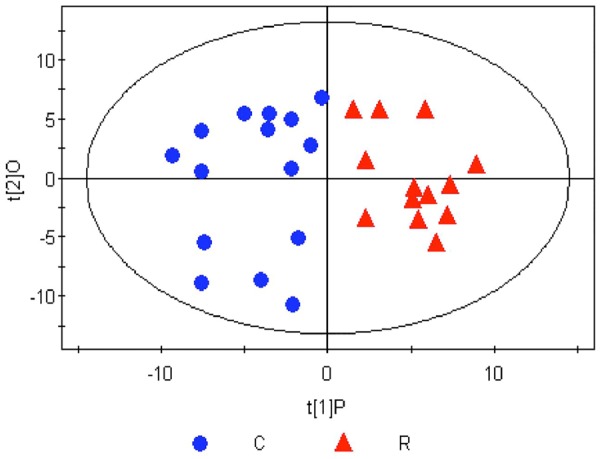
Figure 5.

Orthogonal partial least squares discriminant analysis (OPLS-DA) score plot of the RIF group and the control group after successful modeling. C, Control group; R, RIF group. To identify the metabolites causing the significant differences, orthogonal partial least squares discriminant analysis (OPLS-DA) was employed to screen the signal unrelated to the model category, namely the orthogonal signal, so as to obtain the OPLS-DA model. The major parameters to assess the quality of the model involve a principal component and an orthogonal component. This OPLS-DA model is suitable for the interpretation of the difference in the metabolism of the samples between the RIF group and the control group. After screening out the noisy signal unrelated to the model category, metabolic profiling on PC1 yielded good separation between the two groups, with the score plots of the samples from the two groups distributed on the left (negative) and right sides of PC1 (t[1]P).
