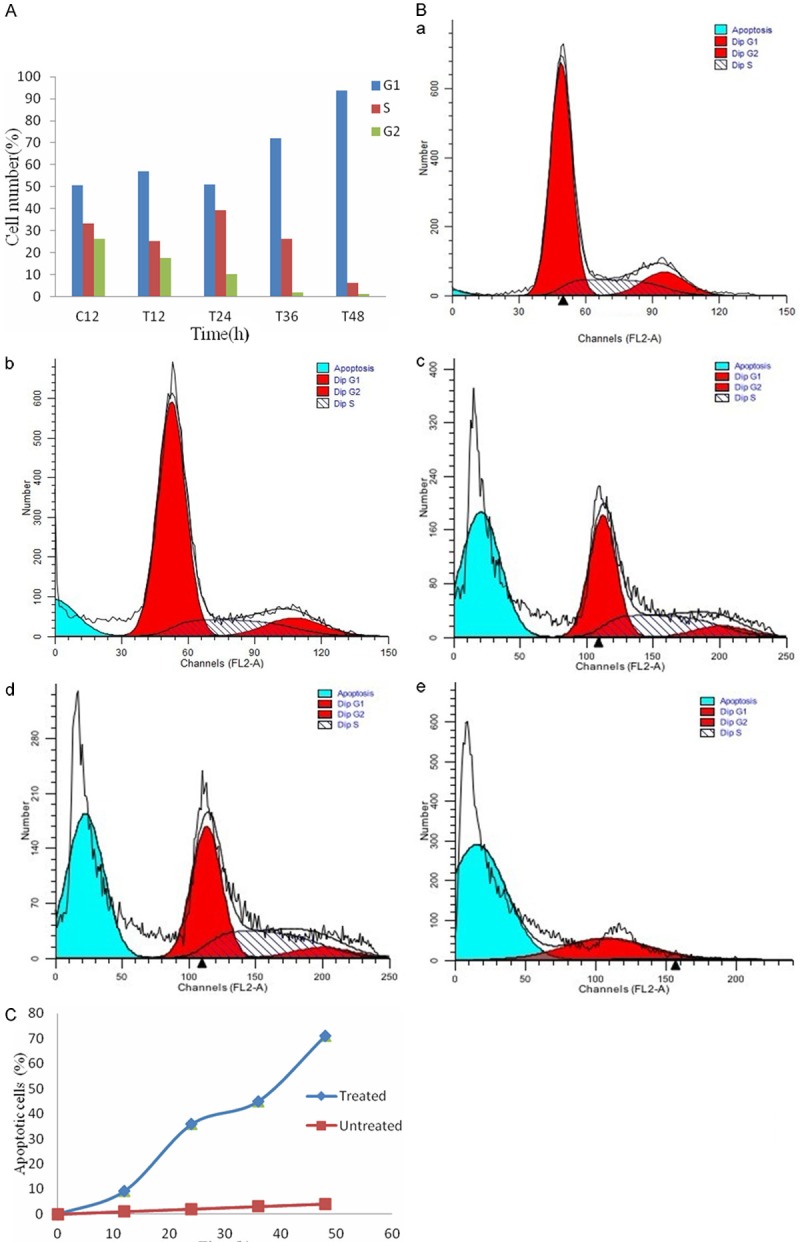
Figure 4.

After treated with γ-terpineol for different times, the vary circumstance of cell cycle percentage and the rates of apoptotic cell was remarkable. The histogram of cell cycle percentage with treated time prolong (A). The cell cycle expression after treated with different times (B), (a) treated with 12 h; (b) treated with 24 h; (c) treated with 36 h; (d) treated with 48 h. The curve chart of the rates of apoptotic cell with treated for different times (C).
