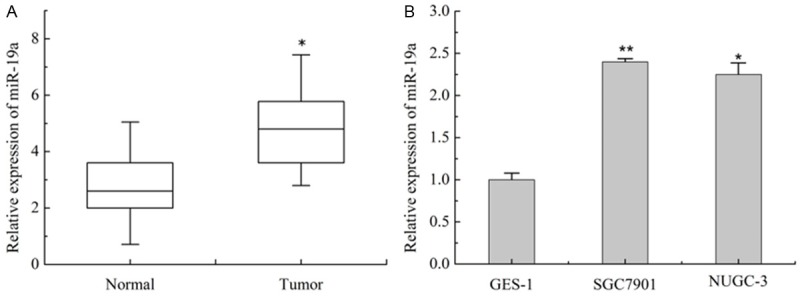
Figure 1.

Expression of miR-19a was upregulated in GC tissue samples and cell lines. A. Expression of miR-19a in 50 GC tissue samples and matched non-tumor tissue samples were detected by qRT-PCR. B. Expression of miR-19a in SGC7901, NUGC-3 and GES-1 that detected by qRT-PCR. Values are the average of triple determinations with the SD indicated by error bars. *P < 0.05, **P < 0.01.
