
Figure 4.
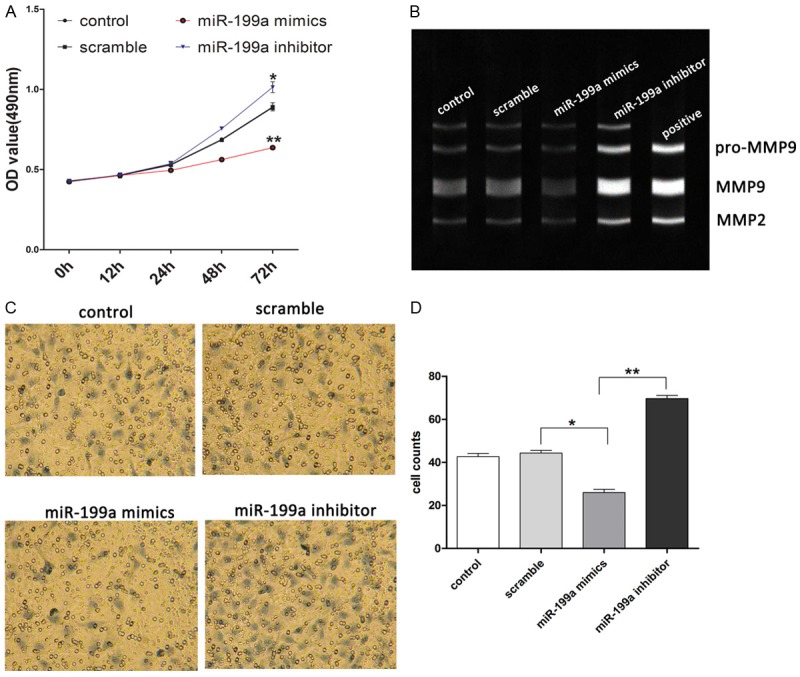
Effects of miR-199a on cell proliferation and migration. (A) Cell proliferation was measured by MTT after transfection. (B) Activation of MMP2/9 was evaluated by gelatin zymography. (C) Cell migration was measured by transwell after transfection. (D) Cell counts of (C). Magnification, 400 ×. Data present as mean ± SD. *P < 0.05, **P < 0.01, ***P < 0.001 VS scramble.