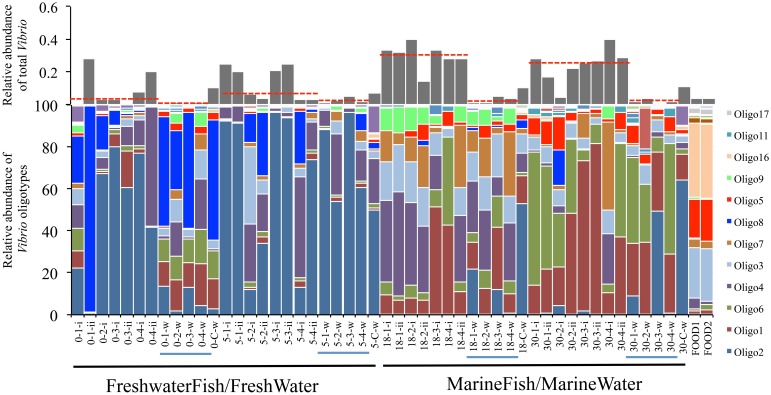
Figure 3.
Oligotype distribution for FreshwaterFish and MarineFish tissue (FreshwaterFish: 0-x-i and 5-x-ii, MarineFish: 18-x-i and 18-x-ii), associated water samples (x-x-W, blue lines), and water samples from aquaria containing no fish (x-C-W). The relative abundance of each oligotype within the total Vibrio diversity for each sample is shown in stacked bar graphs (bottom), and the proportion of the total Vibrio (relative abundance) within all bacterial diversity for each sample is shown with gray bars (top, red-dashed lines are median values for each host-habitat). A clear division between low and high salinity samples is seen, despite considerable variation within salinities. Significant differences in median total Vibrio relative abundance exists between FreshwaterFish and MarineFish samples, and between MarineFish samples and their surrounding water. The Vibrio community of fish food used during experimental period is also shown (“FOODX”).

