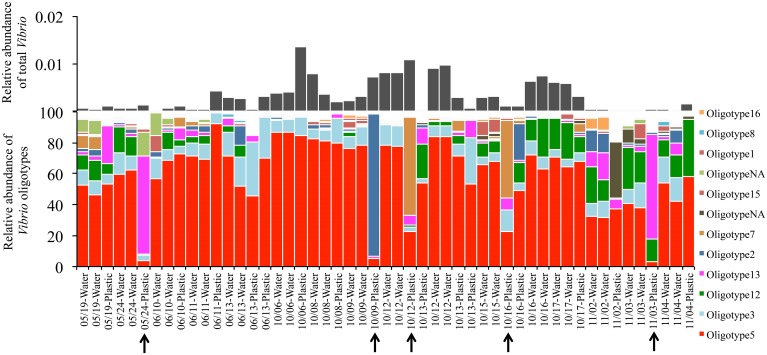
Figure 4.
Oligotype distributions for Plastic samples and their surrounding water. Sample labels indicate the date the samples were collected and the sample type. Water and plastic samples collected on the same date are associated with one another. All water was collected at the surface. Black arrows indicate plastic samples that contain a single oligotype at greater than 50% relative abundance. “OligotypeNA” represents an oligotype that was not among the top 10 most abundant oligotypes from any three of our oligotype groupings.

