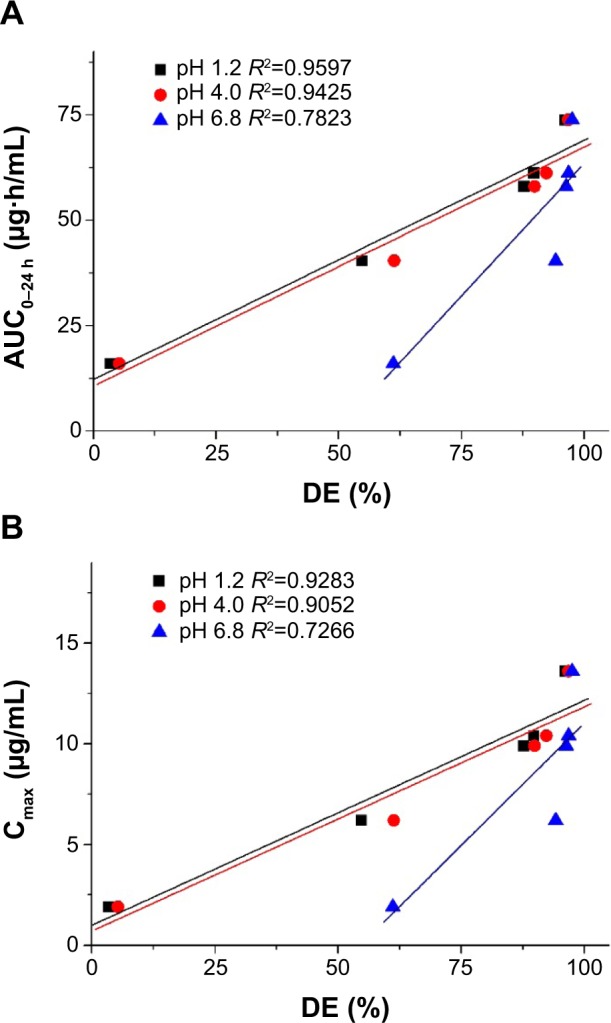
Figure 7.

Correlation between the in vitro dissolution efficiency and in vivo pharmacokinetic parameters.
Notes: (A) AUC0–24h; (B) Cmax.
Abbreviations: AUC0–24 h, area under the concentration-time curve; Cmax, peak concentration; DE, dissolution efficiency; R2, coefficient of determination.
