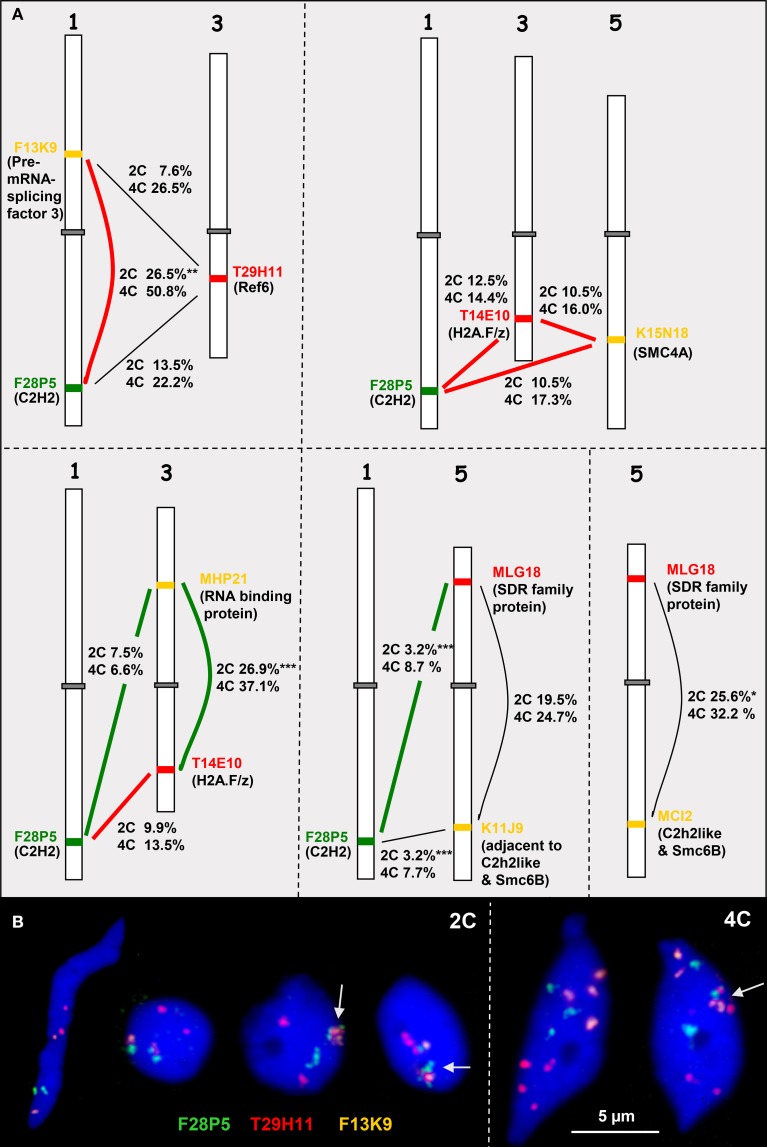
Figure 5.
Heterologous associations in cis and trans. (A) Schemes of chromosomes 1, 3, and 5 showing euchromatin segments (probed by BACs) containing high (connected by bold red lines) or low (bold green lines) co-expressing genes (encoded proteins in parentheses). The percentage of association in cis or trans in 2C and 4C nuclei is indicated (for number of nuclei analyzed see Table S3). The thin black lines indicate combinations with missing co-expression data. (B) Examples of 2C and 4C nuclei showing different configurations of euchromatic segments probes by BACS F28P5, T29H11, and F13K9. The segments may be associated (arrows) or separated. Compare 2C values with the simulated random values according to the RSD model for loci at different arms of the same chromosome (17.2%) and for loci located at different chromosomes (9.9%) (*P < 0.05, **P < 0.01; ***P < 0.001).

