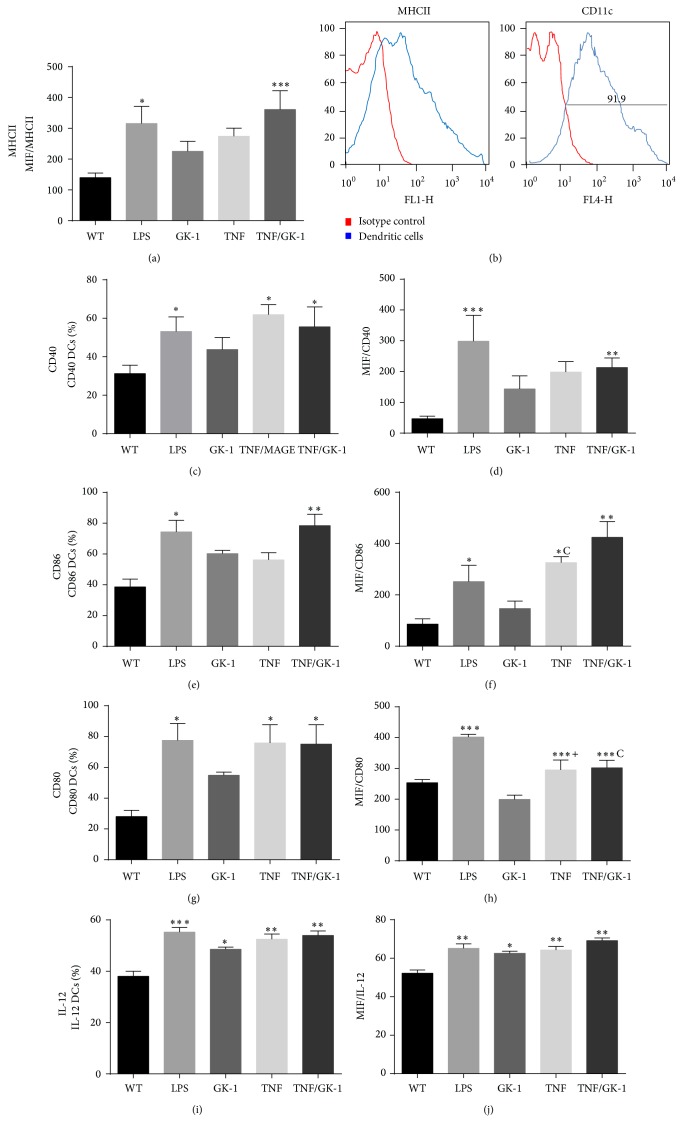
Figure 1.
BMDCs phenotype. Levels of molecules of the major histocompatibility complex II (MHCII), CD40, CD80, CD86, and IL-12 in BMDCs were measured after different treatments: control (without treatment: WT), LPS, GK-1, TNFα, TNFα/GK-1. Treatment with LPS, TNFα, and TNFα/GK-1 induces increased expression of MHCII, CD40, CD80, and CD86. When BMDCs were treated only with GK-1 an increase in the production of IL-12 was found. (a) Mean fluorescence intensity (MIF) of MHCII. * P < 0.05, *** P < 0.001. (b) BMDCs phenotype after 10 days of differentiation. 91.9% differentiation was induced (91.9% of CD11c+ cells). Red: isotype control. Blue: BMDCs. (c) Percentage of CD40+ BMDCs after treatment. * P < 0.05. (d). MFI of CD40 in BMDCs. ** P < 0.001, *** P < 0.0001. (e) Percentage of CD86+ BMDCs. * P < 0.05, ** P < 0.001. (f) MFI of CD86 in BMDCs. * P < 0.05, ** P < 0.001, c P < 0.05 TNFα versus GK-1. (g) Percentage of CD80+ BMDCs. * P < 0.05. (h) MFI of CD80 in BMDCs. ANOVA, Tukey. *** P < 0.0001, c P < 0.0001 TNF/GK-1 versus GK-1, + P < 0.0001 TNF versus GK-1. (i) Percentage of IL-12+ BMDCs. (j) MFI of IL-12 in BMDCs. * P < 0.05, ** P < 0.001, *** P < 0.0001. Mean ± SEM n ≥ 3.

