
Figure 1.
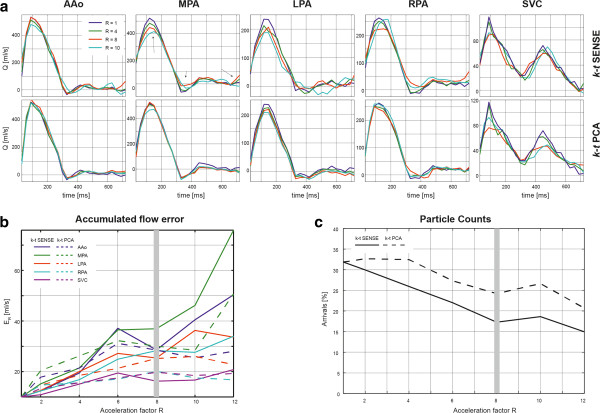
Undersampling simulation results. a) Retrospectively undersampled and reconstructed data using k-t SENSE and k-t PCA for different acceleration factors along with data from the fully sampled reference (R = 1). b) Accumulated flow errors as a function of the acceleration factor for k-t SENSE (full lines) and k-t PCA (dotted lines). An acceleration factor of 8 (grey vertical line) was chosen for all prospective acquisitions. c) Percentage of particles ejected from the ascending aorta reaching the descending aorta as a function of the acceleration factor.