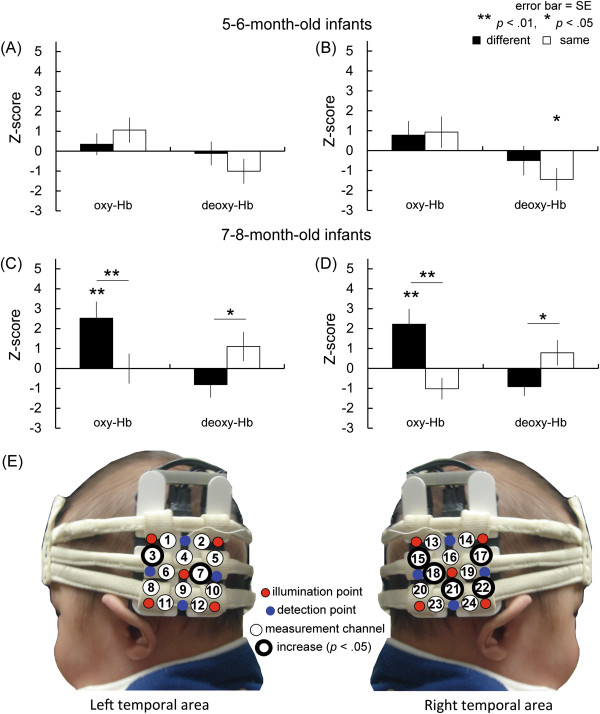
Figure 2.

Mean Z-score of oxy- and deoxy-Hb (A-D) and the channels that showed significant increases of oxy-Hb (E). (A-D) The black bar represents the mean Z-score of the different-face condition, and the white bar represents that of the same-face condition. For 5- to 6-month-olds (A and B), deoxy-Hb in the same-face condition significantly decreased in the right temporal area. At 7- to 8-month-olds (C and D), oxy-Hb concentration in both temporal areas significantly increased compared to the baseline (0). Furthermore, oxy-Hb and deoxy-Hb in bilateral temporal areas significantly differed between the same-face and different-face condition. (E) The channels showed significant increases of oxy-Hb in the different-face condition compared to the baseline period in 7- to 8-month-olds (two-tailed t-test, p < .05). The significant p-value α was determined on the basis of the method of controlling the false discovery rate. In these channels, oxy-Hb concentration differed significantly between the same-face condition and the different-face condition. (The infant’s parents provided written informed consent for publication of this photograph.).
