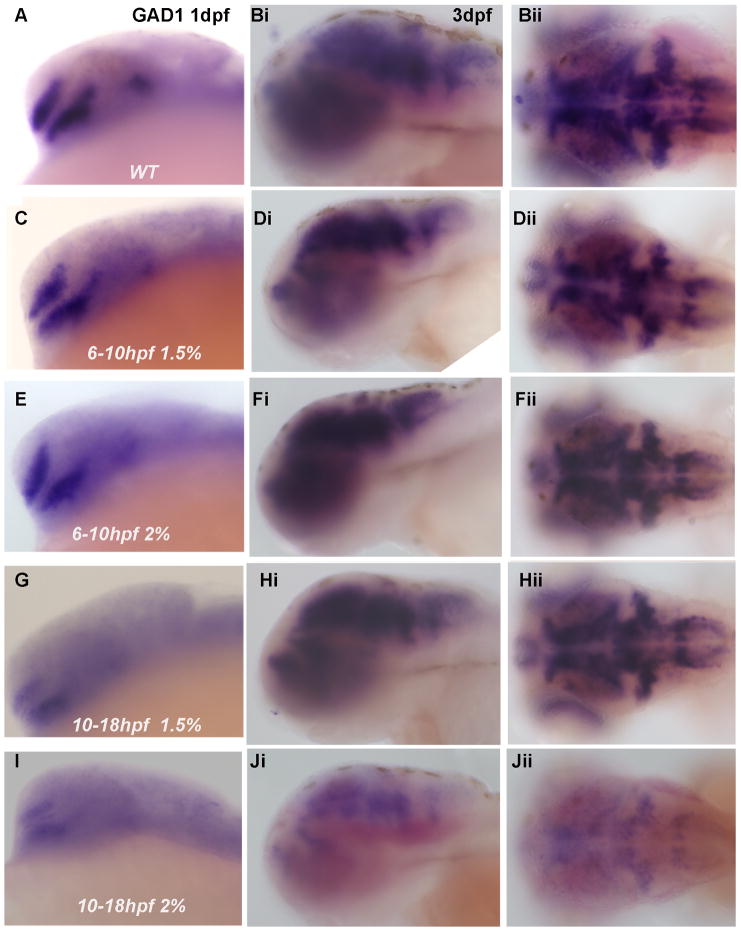
Figure 4. Ethanol exposure from 10–18 hpf induces more severe GAD1 expression phenotypes than ethanol exposure from 6–10 hpf.
(A–Jii) Analysis of GAD1 mRNA expression in 1 dpf embryos (lateral view, A, C, E, G and I) and 3 dpf embryos (lateral view and dorsal view respectively, Bi-Bii, Di-Dii, Fi-Fii, Hi-Hii and Ji-Jii). (A, B) WT; (C, D) 6–10 hpf 1.5% ethanol; (E, F) 6–10 hpf 2% ethanol; (G, H) 10–18 hpf 1.5% ethanol; (I, J) 10–18 hpf 2% ethanol. GAD1 expression in (C–Fii, Hi-Hii) is similar to that in WT (A–Bii). Decreased GAD1 expression is observed in (G and I–Jii). The ratio of the embryos from different ethanol exposure times and concentrations that show the above abnormal phenotypes is shown in Table 2.

