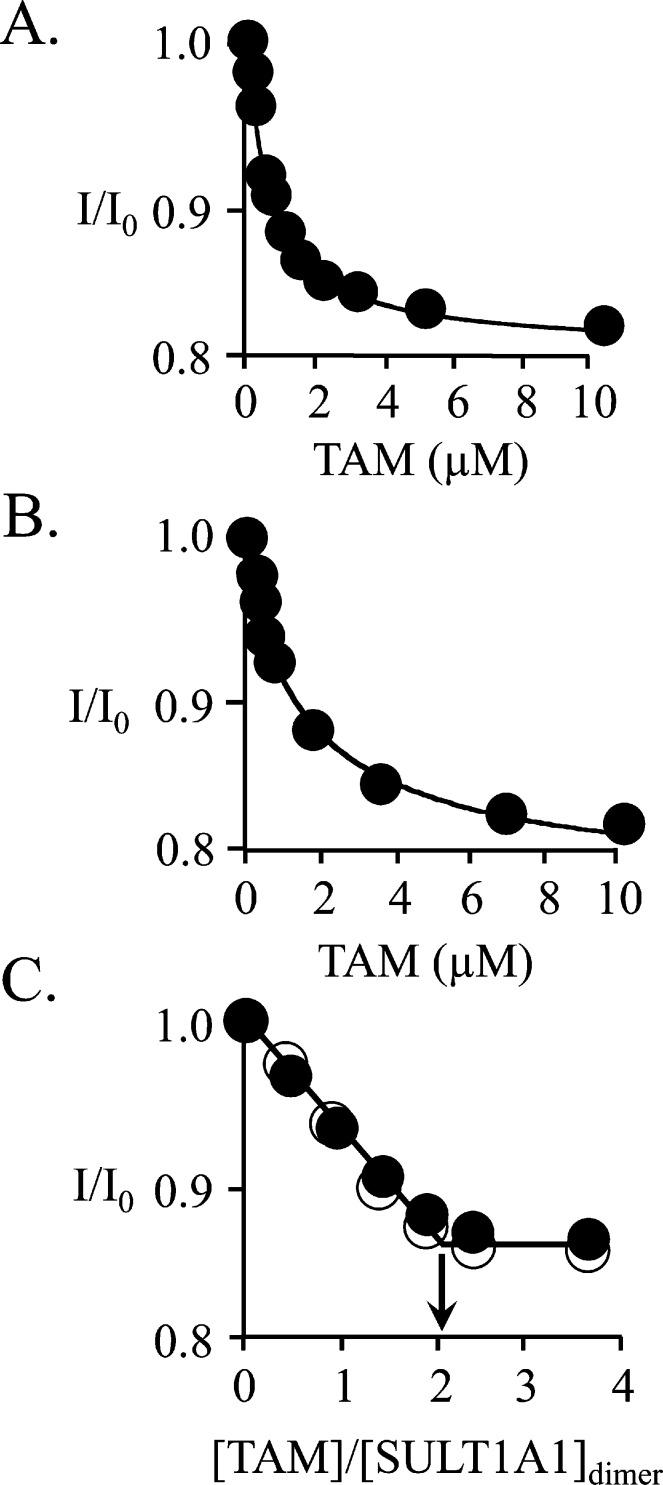
Figure 3.
Binding of TAM to E and E·(PAP)2. (A) TAM binding to E. Binding was monitored via changes in SULT1A1 intrinsic fluorescence (λex = 290 nm; λem = 345 nm). Reaction conditions included SULT1A1 (0.10 μM, dimer), MgCl2 (5.0 mM), NaPO4 (50 mM), pH 7.2, and 25 ± 2 °C. Each point is the average of three independent determinations. The curve is the behavior predicted by a best fit model that assumes a single binding site per dimer. Kd = 0.67 ± 0.04. (B) TAM binding to E(PAP)2. Conditions and data analysis were identical to those described for panel A except PAP = 0.50 mM (17Kd for PAPS binding at its low-affinity site). The Kd for TAM binding is 0.68 ± 0.12 μM. (C) Stoichiometry of binding of TAM to E and E·(PAP)2. Conditions were identical to those described for panels A and B except that [SULT1A1] = 10 μM (dimer). Binding to E and E·(PAP)2 is shown with filled and empty circles, respectively. The stoichiometries are 2.0 ± 0.1 TAM bound per SULT1A1 dimer.

