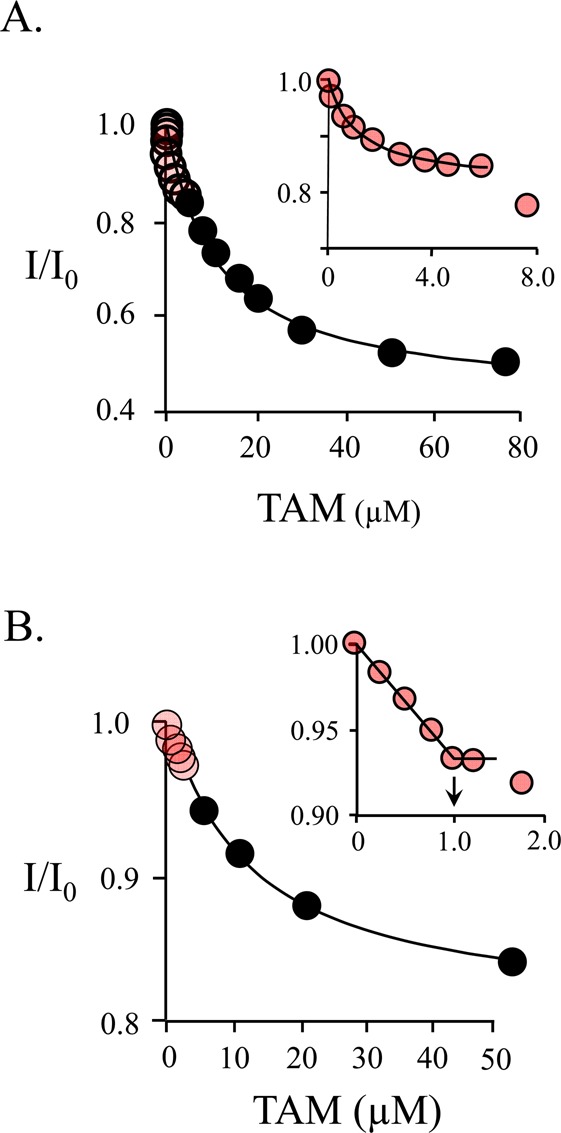
Figure 4.

Binding of TAM to SULT1A1. (A) TAM binding is biphasic. Binding was monitored via changes in SULT1A1 intrinsic fluorescence (λex = 290 nm; λem = 345 nm). The titration conditions included SULT1A1 (0.10 μM, dimer), PAP (6.0 μM), MgCl2 (5.0 mM), NaPO4 (50 mM), pH 7.2, and 25 ± 2 °C. The distribution of enzyme forms at 6.0 μM PAP is as follows: E·PAP, 79%; E·(PAP)2, 16%; E, 5.0%. The first phase (red dots, inset) shows binding of TAM to the PAP-free subunit of SULT1A1 (Kd = 0.67 ± 0.05 μM). The second phase shows binding of TAM to the nucleotide-bound subunit (Kd = 13 ± 2 μM). Each point is the average of two independent determinations. The line through the points is the behavior predicted by a best-fit model that assumes a single binding site per dimer. The first and second phases were fit separately using the data indicated by the red and black circles, respectively. (B) Semiquantitative stoichiometric binding of TAM. The conditions of the titration included SULT1A1 (9.0 μM, dimer), PAP (9.0 μM), MgCl2 (5.0 mM), NaPO4 (50 mM), pH 7.2, and 25 ± 2 °C. At these concentrations, the distribution of enzyme forms is as follows: E·PAP, 77%; E·(PAP)2, 3.8%; E, 19%. The binding is biphasic. The first phase (red dots, inset) indicates a stoichiometry of approximately one TAM binding site per dimer. A second low-affinity phase is also observed (black dots).
